- Route 53 Rundown
- Posts
- Fully Understanding CloudWatch Cost Breakdown & How to Reduce It
Fully Understanding CloudWatch Cost Breakdown & How to Reduce It
We go over why CloudWatch usually increase, and here’s how to reduce CloudWatch!
Route 53 Rundown
May 03, 2025

"Why are my AWS CloudWatch costs suddenly increasing?
CloudWatch is powerful, providing critical visibility into application performance, resource utilization, and operational health. But as infrastructure expands, so too can the complexity and cost of monitoring!
Fun Fact: CloudWatch has monitored more than 800 trillion metric observations, and costs often rise quietly, creeping upward as your data ingestion, storage durations, log group management, and detailed metric requests steadily grow. Eventually, these incremental expenses become noticeable, raising eyebrows and budget questions alike.
Good news… controlling and optimizing your CloudWatch expenses doesn't have to be complicated. In this post, I'll break down exactly what's causing your CloudWatch bill to climb and provide straightforward, practical strategies you can immediately implement.
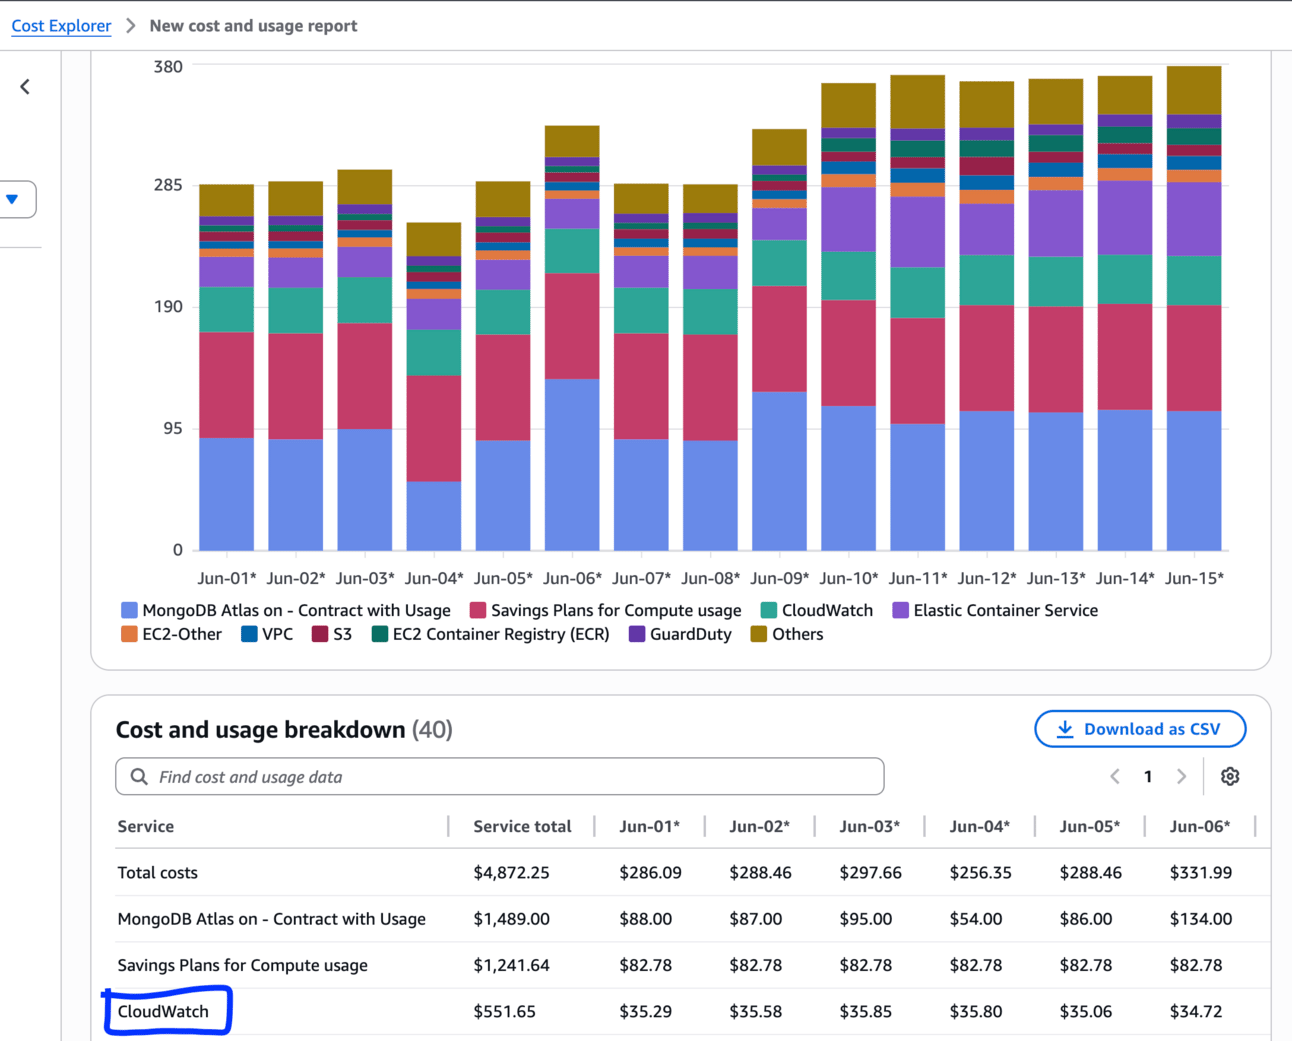
I have firsthand seen the costs of CloudWatch rise. I had a conversation with a client, where the third largest cost by service was CloudWatch. This shouldn’t have been the case, and so we worked together to reduce their CloudWatch costs to be the 10th largest cost by service.
From identifying unnecessary metric granularity and optimizing log retention policies to understanding pricing models, I’ll show you precisely how to keep visibility high while significantly lowering your AWS CloudWatch spend.
If you haven’t already, I highly recommend reading my AWS Cost Explorer Post that will help you first learn how to use AWS Cost Explorer.
About How Route 53 Rundown Got Started
What is AWS CloudWatch?
AWS CloudWatch is a monitoring and observability service. It helps you collect, visualize, and act on metrics, logs, and events from AWS resources, applications, and on-premises systems.
Some of the Key Features:
Metrics Monitoring: Tracks performance data like CPU usage, memory, request latency, etc
Log Collection & Analysis: Aggregates logs from services like EC2, Lambda, RDS, etc., and lets you search and analyze them
Alarms: Set thresholds to trigger actions (like notifications or auto-scaling) when a metric crosses a limit
Dashboards: Visualize metrics in real-time using customizable dashboards
Events: Respond to changes in your AWS environment automatically (e.g., start a Lambda when an EC2 state changes)
It’s widely used for troubleshooting, performance optimization, and automation.
Here’s a helpful video that talks about AWS CloudWatch:
Here are 5 ways to reduce CloudWatch:
While AWS CloudWatch is essential for visibility, it can get expensive fast, especially if you’re collecting detailed logs and custom metrics. Here are 5 smart ways to cut CloudWatch costs without losing control of your cloud:
1. Store Only What You Need
Avoid logging everything. Focus on critical events like errors, warnings, and key performance indicators. Filter out unnecessary debug logs to cut down on storage. I would recommend time blocking 30 minutes or 1 hour with one or two people to go over everything you are logging. Build a culture where you ask some questions like:
Do you need to log this?
If you didn’t log this, what would happen?
Are there other ways we can simplify the list of performance indicators?
2. Lower Retention Periods
CloudWatch charges more the longer you keep logs and metrics. Set shorter retention times for data you don’t need long term.
3. Use Metric Streams or OpenTelemetry
Instead of storing all custom metrics in CloudWatch, stream them to Amazon S3, Prometheus, or a third-party observability platform. It’ll be cheaper than CloudWatch in terms of S3.
How would you do this? You would need to develop a script that pulls the CloudWatch metrics that you wish to store (in this case, let’s say it is ELB metrics) using the AWS CLI and copy those metrics to your S3 bucket on a regular basis.
4. Aggregate Logs and Metrics
Reduce data volume by aggregating logs at the application level. For example, log summaries once per minute instead of every few seconds.
5. Track Usage with AWS Cost Explorer
Use Cost Explorer or enable usage metrics in CloudWatch to identify the most expensive resources. Optimize those first for the biggest savings. As I mentioned, if you haven’t already, I highly recommend reading my AWS Cost Explorer Post.

Case Study: Here is How One Startup Cut AWS CloudWatch Costs by 62%
The Company: The Planet Earth Organic Growing Carrot Company (TPEOGCC)
Industry: SaaS
Team Size: 35 engineers
Challenge: Unexpectedly high AWS CloudWatch bills impacting cloud budget
The Problem
TPEOGCC relied heavily on AWS CloudWatch to monitor performance across microservices, Lambda functions, and API gateways. Over time, they began seeing monthly CloudWatch costs exceed $3,000. The culprit? Unfiltered logs, long retention periods, and an overload of custom metrics from staging environments.
The Approach
To regain control, the team implemented a cost-reduction plan focused on three key actions:
Filtered logging
Updated all services to log onlyERRORandWARNlevels in staging and production. Debug logs were disabled unless actively troubleshooting.Log retention tuning
Reduced log retention from the default 30 days to 7 days for most non-critical services. Some test environments were set to 1-day retention.Metric optimization
Shifted nonessential custom metrics to an internal Prometheus setup. Only vital metrics like latency, request count, and error rate were kept in CloudWatch.
The Result
Within 30 days, TPEOGCC saw CloudWatch costs drop from $3,100 to $1,180 per month, a 62% reduction. Performance visibility was unaffected, and developers reported cleaner logs that were easier to work with.

It is important to note that you should first look at AWS Cost Explorer before doing cost / infrastructure optimization. For example, you probably don’t need to focus as much on EUW2-CW:GMD-Metrics versus EUW2-CW:MetricMonitorUsage (which is well over 75% of the CloudWatch spend filtered by usage type.
Once you follow the steps I mentioned above, also consider checking this video by the AWS developer team, where they help you cut costs on CloudWatch:
Thanks for reading this, and have a wonderful day!
Yaddle Out